The Basic Economic Problem

Welcome to the first unit of IGCSE Economics! In this chapter, we will cover topics some initial topics like 'The nature of the economic problem' to a bit more involved areas like 'Production possibility curve (PPC) diagrams'.
Don't worry, this all may sound greek to you, and we have intentionally designed the notes to hand-hold you through the entire process 🤗
First things first, let's understand two key terms, Economics and Economist.
Economics
A social science that studies how individuals, governments, firms and nations make choices on allocating scarce resources to satisfy their unlimited wants.
Economics can generally be broken down into: macroeconomics, which concentrates on the behaviour of the aggregate economy; and microeconomics, which focuses on individual consumers.
Economist
An economist is a professional in the social science discipline of economics. The individual may also study, develop, and apply theories and concepts from economics and write about economic policy.
There is a popular publication that we encourage you to read and follow as you prepare for the IGCSE Economics exams 👇
The Two Branches of Economics
You may have come across the terms 'Microeconomics' and 'Macroeconomics' before. In this section, we will learn what these exactly mean in simple terms.
Microeconomics
The study of a small part of the whole economy & deals with demand & supply of goods.
Microeconomics is a branch of economics that studies the behaviour of individual households and firms in making decisions on the allocation of limited resources.
Typically, it applies to markets where goods or services are bought and sold.
Macroeconomics
The study of the economy as a whole & deals with national income & international trade.
Macroeconomics is a branch of economics dealing with the performance, structure, behaviour, and decision-making of an economy as a whole, rather than individual markets.
This includes national, regional, and global economies.
The Two Types of Statements in Economics
Positive statements
Positive statements are objective statements that can be tested, amended or rejected by referring to the available evidence.
Positive economics deals with objective explanation and the testing and rejection of theories.
For example:
- A fall in incomes will lead to a rise in demand for own-label supermarket foods
- If the government raises the tax on beer, this will lead to a fall in profits of the brewers.
- The rising price of crude oil on world markets will lead to an increase in cycling to work
- A reduction in income tax will improve the incentives of the unemployed to find work.
- A rise in average temperatures will increase the demand for sun screen products.
- Higher interest rates will reduce house prices
- Price cuts on alcohol has increased the demand for alcohol among teenagers.
Normative statements
Normative statements are subjective statements rather than objective statements – i.e. they carry value judgments.
For example:
- Pollution is the most serious economic problem
- Unemployment is more harmful than inflation
- The congestion charge for drivers of petrol-guzzling cars should increase to $10
- The government should increase the minimum wage to £6 per hour to reduce poverty.
- The government is right to introduce a ban on smoking in public places.
- The retirement age should be raised to 65 to combat the effects of our ageing population.
- Resources are best allocated by allowing the market mechanism to work freely
Scarcity
Excess of human wants over what can actually be produced.
As human wants are unlimited & resources are Scarce, it is not possible to satisfy everything for every one which is called scarcity.
So, we need to make a choice which involves opportunity cost ( Net best alternative given up when we make a choice).
Factor Of Production (Resources)
Resources of an economy are the factors of production or the inputs which are used to produce an output i.e. goods and services. These can be classified into four categories.
Land

Land includes all resources found in the sea and on land. They are also known as natural resources.
Land is said to be immobile and is limited in supply. Land is subject to the law of diminishing returns.
Law of diminishing returns states that given a fixed factor, variable factors added to it will eventually lead to a fall in marginal product.
Characteristics of Land
- Immobile
- Climatic condition, mineral deposits, etc are gift of nature.
- It is limited in supply.
- It is subjected to the law of diminishing returns.
- Climatic Conditions
Labour

Labour refers to input of human efforts, both physical and mental. However, only those human efforts are considered in economics as labour which has the sole purpose of receiving rewards.
Any kind of labour done for pleasure is cannot be considered as labour. Labour has greater mobility than land but is less mobile than capital and cannot be stored.
Characteristics of Labour
a) A labourer sells his services only.
b) Labour services cannot be stored and separated from the worker.
c) Labour has greater mobility than land.
Mobility of labour
Refers to the movement of labour. There are two types of labour mobility. These are:
1. Geographical mobility
It is the movement of labour from place to another.
But there are many barriers to geographical mobility which are as follows:
- Political instability in a country.
- The cost of moving from one place to another.
- Sense of belonging to one’s country.
- Workers may have insufficient information or unawareness of the opportunities existing in different places.
- Sometimes age may be a factor. Older workers are more immobile than younger ones.
- Social ties or sentimental reason may discourage workers to move to other places.
2.Occupational mobility
It refers to the willingness and mobility of worker to change from one occupation to another.
Obstacles (prevention) to Occupational Mobility of Labour
a) Lack of necessary skills & qualification
b) Older worker are less mobile than younger workers.
c) Having close ties with colleagues & supervisors.
d) Insufficient information about job availability.
e) Unwillingness to take risks by changing job.
f) Entry requirements. E.g.: Pilot must have a minimum height & good eyesight.
g) Under a contract. Contractual obligations.
Capital

Fancy way of saying 'Money'
These are manmade resources which help to produce many other goods and services.
It can be classified as:
Fixed capital
These are physical assets which do not vary as the level of output varies and its form does not change in the course of production. Examples include factories, machines, and dockyards and so on.
Working capital
It consists of stocks of raw materials and stocks of semi-finished and finished goods awaiting purchase of consumers. It varies with the level of output. Thus, when output increases, the working capital also increases.
Social Capital
Increase the productivity of the labour force in a country. Educational, housing facilities etc. Usually provided by the government.
Capital Formation-
Country’s ability to increase its assets or capital whereby new real assets are created. There must be savings for public. Opportunity cost is involved. Capital formation can increase the wealth of the nation with more goods & services being produced.
Reasons for low capital formation in developing country
- In developing countries, the rate of capital formation is low because of the poverty. With insufficient level of savings, there will be low capital formation. Consequently, there will be less economic growth & the country remains poor.
Several ways the government must increase the rate of capital formation
a) The governments of developing countries take a loans from international agencies. The government can also borrow from the governments of developed countries.
b) Attracting foreign investment- Create employment.
c) Better infrastructure will encourage foreign investors.
d) Aids & grants.
Entrepreneur

An entrepreneur is the person who brings all the factors of production together and organises them to produce goods and services.
An entrepreneur decides what to produce, how to produce and for whom to produce. Entrepreneur responsible for arranging how production should take place, making the following decision: How, how much, for whom to produce.
The entrepreneur also co-ordinates all the factors of production to produce goods & services.
Functions of an entrepreneur
a) Co-ordinates the factors of production.
b) The entrepreneur will undertake research & development.
c) Responsible for marketing his/her product.
d) The entrepreneur undertakes the risks & is responsible for all the decisions.
TWO types of risks.
a) Insurable risks- Risks which the insurance company will pay for part of the damage.
b) Non-insurable risks- No insurance company will bear such costs
Production Process

An economic process of producing goods & services to satisfy human wants & to maximize profits.
Production Possibility Curves
Opportunity cost (or economic cost or real cost) is not the money we pay for the want, but the alternative want that we have to forego.
The issue of choice, and the concept of opportunity cost associated with the economic problem, can be illustrated by using the production possibility frontier (or curve).
A production possibility frontier shows the various combinations of two alternative products that can be produced given a fixed level of technology and a fixed quantity of resources, when all resources are used to their full capacity,
What is obtainable is based on the following assumptions:
- The resources available are fixed.
- The technology remains unchanged.
- The resources are fully employed.
- The resources are efficiently employed.
- The resources are not equally efficient in production of all products. Thus if resources are transferred from production of one good to another, the cost increases. In other words marginal opportunity cost increases.
The last assumption needs explanation because it determines the shape of the PP curve. If this assumption changes, the shape changes.
Efficiency in production means productivity i.e. output per unit of an input. Let the input be worker.
Suppose an economy produces only two goods X and Y. Suppose a worker is employed in production of X because he is best suited for it.
The economy decides to reduce production of X and increase that of Y. The worker is transferred to Y.
He is not that efficient in production of Y as he was in X. His productivity in Y will be low, and so cost of production high.
The implication is clear. If the resources are transferred from one use to another, the less and less efficient resources will be transferred leading to rise in the marginal opportunity cost which is technically termed as marginal rate of transformation (MRT).
Marginal Rate of Transformation

To simplify, let us assume that only two goods are produced in an economy. Let these two goods be guns and butter, the famous example given by Samuelson. The guns symbolise the defence goods, and butter, the civilian goods.
The example, therefore, symbolises the problem of choice between civilian goods and war goods. In fact it is a problem of choice before all the countries of the world.
Suppose if all the resources are engaged in the production of guns, there will be a maximum amount of guns that can be produced per year. Let it be 15 units (one unit may be taken as equal to 1000, or one hundred thousand and so on).
At the other extreme suppose all the resources are employed in production of butter only.
Let the maximum amount of butter that can be produced is 5 units. These are the two extreme possibilities.
In between there are others if the resources are partly used for the production of guns and partly for production of butter.
Given the extremes and the in-between possibilities, a schedule can be prepared. It can be called a production possibilities schedule. Let the schedule be:

In the table the possibility A is one extreme. The society devotes all the resources to guns and nothing to butter.
Suppose the society wants one unit of butter.
Since resources are limited and fully and efficiently employed, to produce one unit of butter some of the resources engaged in production of guns have to be transferred to the production of butter.
Let the resources worth one unit of gun are enough to produce one unit of butter.
This gives us the second possibility with MRT = 1G/IB.
Now suppose that the society wants another unit of butter. This requires transfer of more resources from the production of guns.
Now we require transfer of resources worth 2 units of guns to produce one more unit of butter.
The MRT rises to 2G/IB. MRT rises because now less efficient resources are being transferred. In this way MRT goes on rising.
We can now define MRT in general terms. MRT is the ratio of units of one good sacrificed to produce one more unit of the other good.

Plotting the Production Possibility Curve
By converting the schedule into a diagram, we can get the Production Possibility (PP) curve. Refer to the figure 1 which is based on the PP schedule.
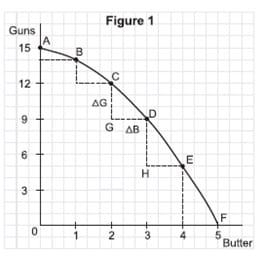
Butter's production is shown on the x-axis and that of guns on they-axis. We can measure MRT on the PP curve.
For example:
MRT between the possibilities:
- C and D is equal to CG/GD. Between D
and
- E it is equal to DH/HE, and so on.
Diagrammatically, the slope of the PP curve is a measure of the MRT.
Since the slope of a concave curve increases as we move downwards along the curve, the MRT rises as we move downwards along the curve.
Characteristics of the Production Possibility Curve
A typical PP curve has two characteristics:
(1) Downward sloping from left to right
It implies that in order to produce more units of one good, some units of the other good must
be sacrificed (because of limited resources).
(2) Concave to the origin
A concave downward sloping curve has an increasing slope. The slope is the same as MRT.So, concavity implies increasing MRT, an assumption on which the PP curve is based.
Can Production Possibility curve be a straight line?

Yes, if we assume that MRT is constant, i.e. slope is constant. When the slope is constant the curve must be a straight line.
But when is MRT constant? It is constant if we assume that all the resources are equally efficient in production of all goods.
Note that a typical PP curve is taken to be a concave curve because it is based on a more realistic assumption that all resources are not equally efficient in production of all goods.
Does production take place only on the PP curve?
Yes and no, both. Yes, if the given resources are fully and efficiently utilized. No, if the resources are underutilized or inefficiently utilized or both.
Refer to figure 3.
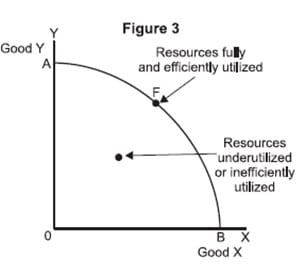
On point F, and for that matter on any point on the PP curve AB, the resources are fully and efficiently employed.
On point U, below the PP curve or any other point but below the PP curve, the resources are either underutilized or inefficiently utilised or both.
Any point below the PP curve thus highlights the problem of unemployment and inefficiency in the economy.
Can the Production Possibility curve shift?
Yes, if resources increase.

More labor, more capital goods, better technology, all mean more production of both the goods.
A PP curve is based on the assumption that resources remain unchanged. If resources increase, the assumption is broken, and the existing PP curve is no longer valid.
With increased resources there is a new PP curve to the right of the existing PP curve.
It can also shift, to the left if the resources decrease (Figure 5). It is a rare possibility but sometimes it may happen due to fall in population, due to destruction of capital stock caused by large scale natural

Quiz Time
Let's test what you learnt so far! Take the quiz to see your initial preparedness for this topic:
📊 Unit 1: Basic Economic Problem Quiz
5 questions to test your understanding
🎉 Quiz Complete!
You did it! Unit 1 ✅ . Proud of you!
As always, thank you for using IGCSE Pro! If you found this revision guide helpful, do subscribe to our mailing list, and tell a friend or two about us 😄. Until next time!